3. 服务器监控部署
3.1. 目的
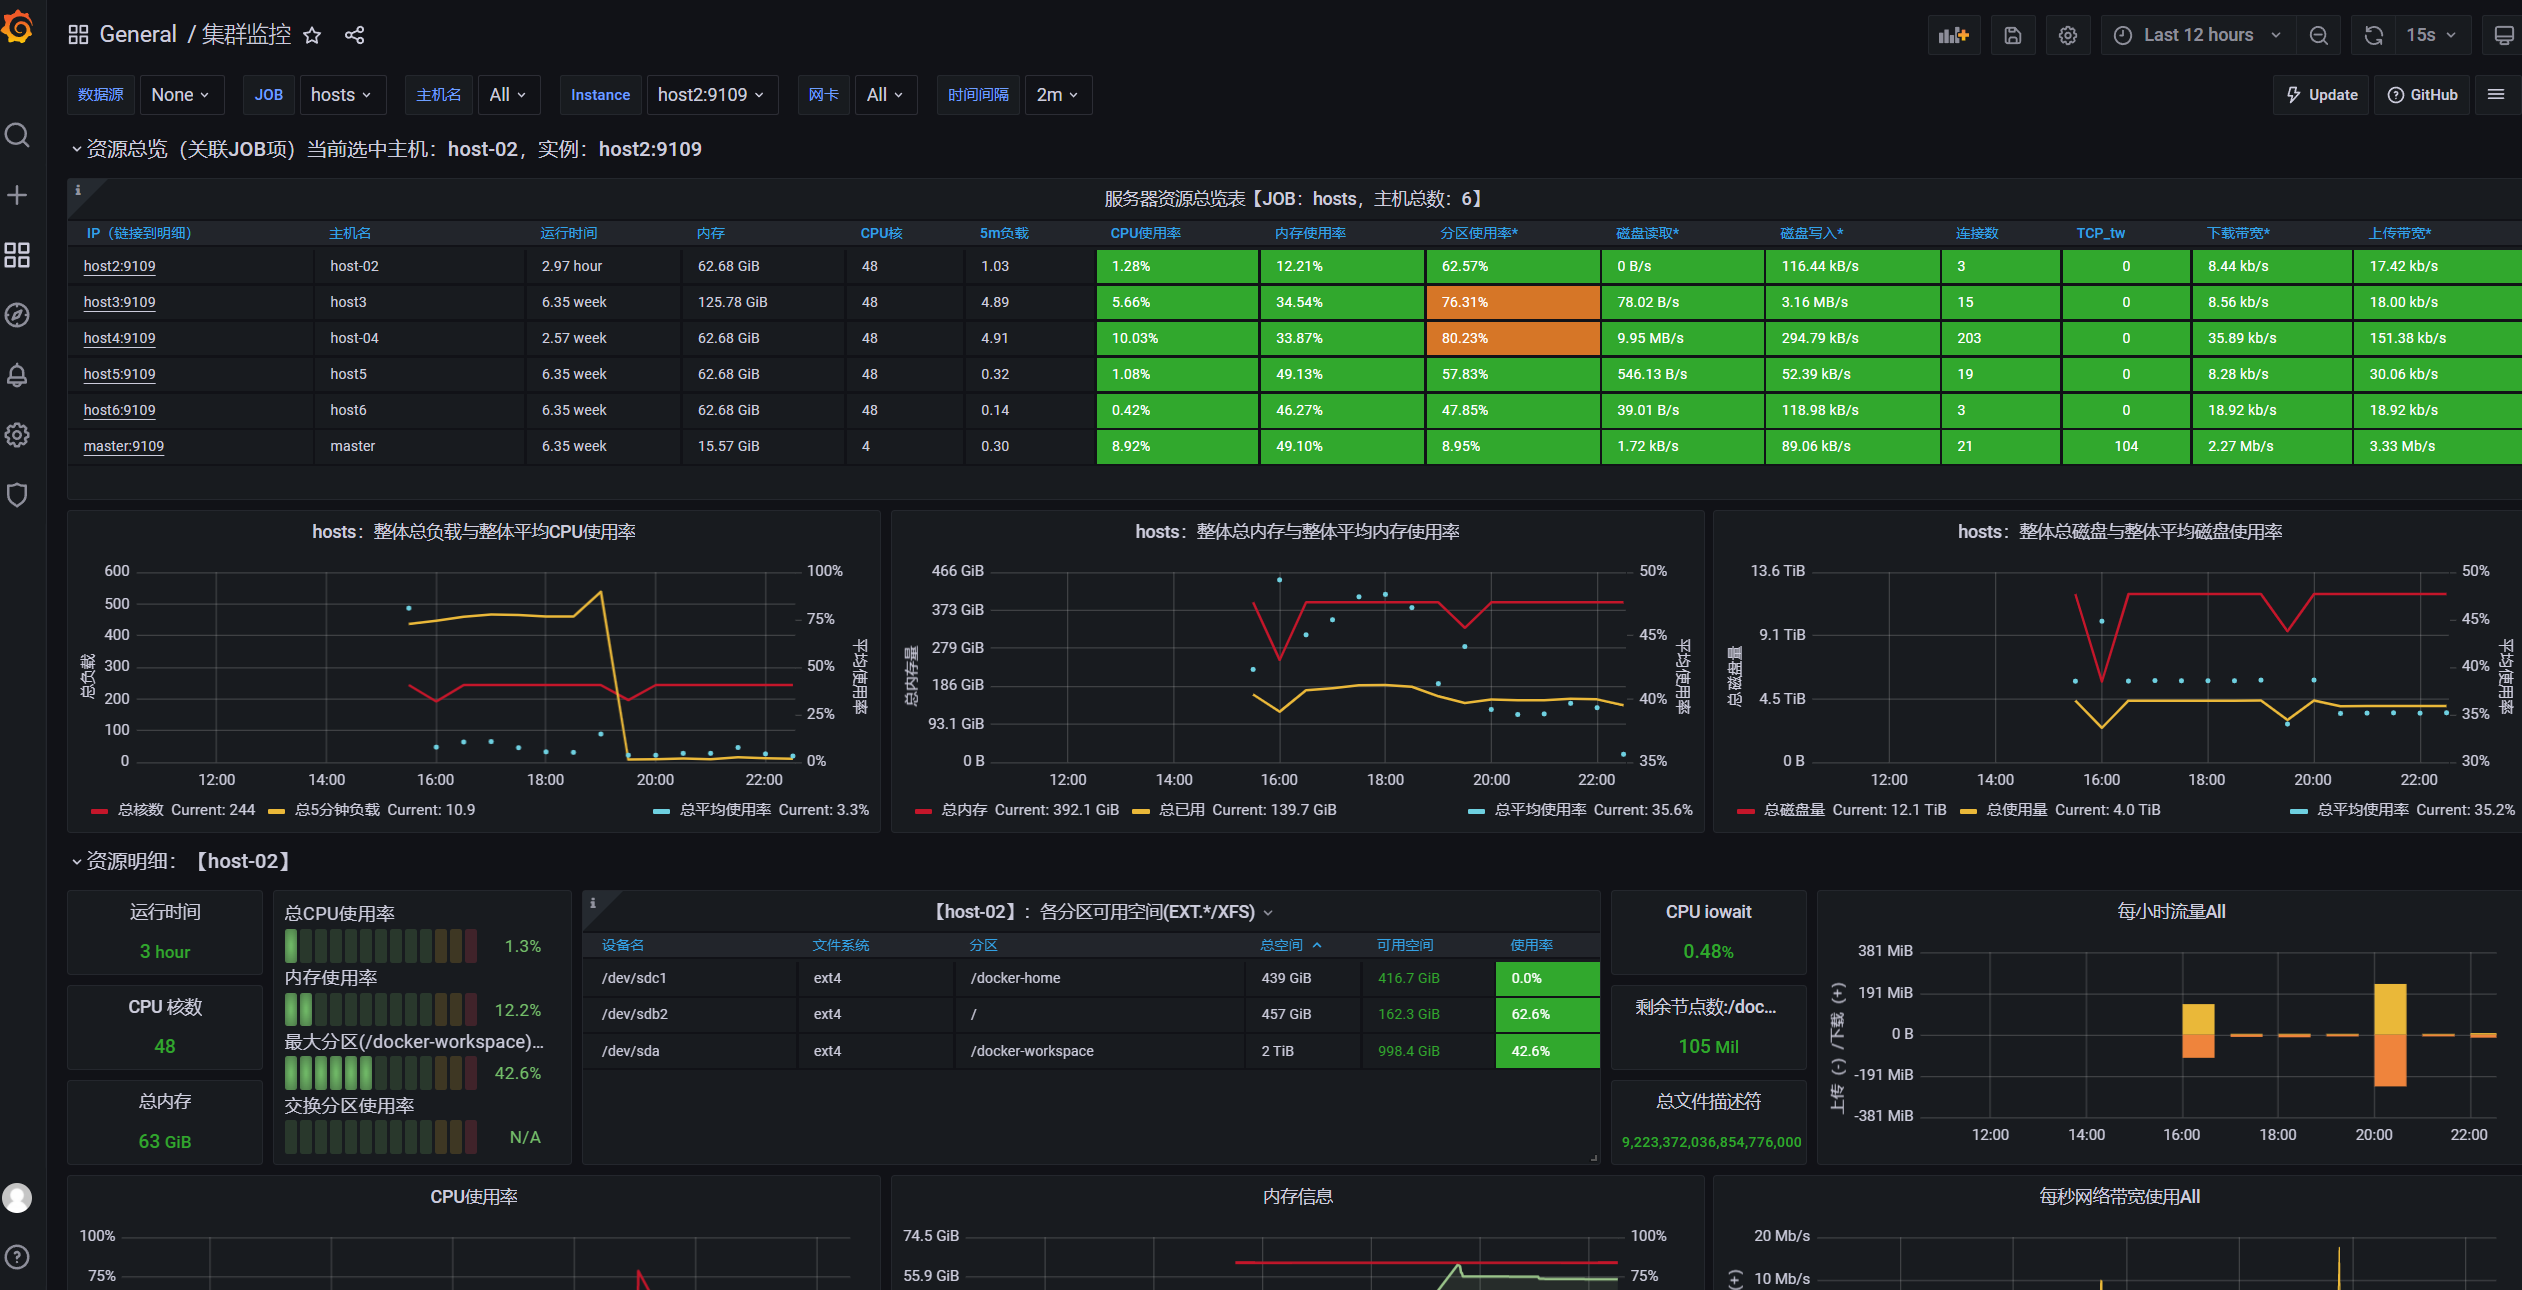
实验室集群因在寒假期间使用内网穿透等原因被挖矿病毒攻击过,为了能及时发现服务器的异常情况搭建了实验室集群基于prometheus, alertmanager, grafana的监控系统。本文文档主要用于介绍服务的部署和备份。
grafana效果图
3.2. 安装步骤
3.2.1. 软件安装
在实验室集群各个节点安装 node exporter: master, host2, host3, host4, host5, host6。
下载安装 node exporter linux 二进制文件,并移动到 path 目录
/usr/local/bin/下。撰写 service 文件开机自启动,
systemctl enable prometheus_node_exporter。# cat /usr/local/lib/systemd/system/prometheus_node_exporter.service [Unit] Description=node_exporter After=network.target [Service] Type=simple User=root # 指定启动的端口和日志级别 ExecStart=/usr/local/bin/node_exporter --web.listen-address=:9109 --log.level=error MemoryLimit=300M CPUQuota=100% Restart=on-failure [Install] WantedBy=multi-user.target
创建配置文件夹
/root/prometheus并创建好对应的配置文件。./ ├── alertmanager.yml // alertmanager 告警配置:将实验室公用邮箱作为邮箱告警发送方,配置发送频率,接收告警的管理员邮箱地址等 ├── alert_rules.yml // prometheus 报警规则:对cpu使用率,内存使用率,设备温度等指标设置报警规则 ├── grafana.ini // grafana 配置文件,使用的是默认文件,挂载出来方便后续使用 ├── prometheus.yml // prometheus 配置文件,设置各个host节点的地址 └── promtool // promtool 二进制文件,./promtool check rules ./alert_rules.yml 可以检查规则文件的正确性
具体的配置文件模板因内容较多,放在了文档末尾。
使用 docker 在上述配置文件的基础上在 master 节点运行各个服务。
prometheus
docker run -itd --name prometheus --restart=always -p 9099:9090 -v /root/prometheus/prometheus.yml:/etc/prometheus/prometheus.yml -v /root/prometheus/alert_rules.yml:/etc/prometheus/alert_rules.yml prom/prometheus
grafana
docker run -itd --restart=always -p 3000:3000 -v /root/prometheus/grafana.ini:/etc/grafana/grafana.ini grafana/grafana
alertmanager
docker run -itd -p 9093:9093 --restart=always --name alertmanager -v /root/prometheus/alertmanager.yml:/etc/alertmanager/alertmanager.yml prom/alertmanager
使用dscl.team路径访问
效果为 grafana.dscl.team -> cddsclab.f3322.net(路由器定时把最近ip通过DDNS告知f3322) -> nginx。

在 master nginx 上面增加 prometheus, alermanager, grafana的转接。 nginx配置是实验室各个服务的核心proxy,主要有:
实验室论坛,https ssl等
/home/dscl/dscl-web/ 实验室网站首页 进master的
/etc/nginx/nginx.confinclude 的/etc/nginx/etc/nginx/sites-enabled/default增加下面配置,记得systemctl restart nginx。
# s3.dscl.team
server {
        listen       80;
        server_name  s3.dscl.team;
        location / {
           #client_max_body_size    1000m;
                   proxy_set_header X-Real-IP $remote_addr;
           proxy_set_header HOST $http_host;
           proxy_set_header X-NginX-Proxy true;
           proxy_pass http://127.0.0.1:9000;
           root   html;
           index  index.html index.htm;
        }
}

# prometheus.dscl.team
server {
        listen       80;
        server_name  prometheus.dscl.team;
        location / {
           #client_max_body_size    1000m;
                   proxy_set_header X-Real-IP $remote_addr;
           proxy_set_header HOST $http_host;
           proxy_set_header X-NginX-Proxy true;
           proxy_pass http://127.0.0.1:9099;
           root   html;
           index  index.html index.htm;
        }
}

# grafana.dscl.team
server {
        listen       80;
        server_name grafana.dscl.team;
        location / {
           #client_max_body_size    1000m;
                   proxy_set_header X-Real-IP $remote_addr;
          proxy_set_header HOST $http_host;
           proxy_set_header X-NginX-Proxy true;
           proxy_pass http://127.0.0.1:3000;
           root   html;
           index  index.html index.htm;
        }
}

# alertmanager.dscl.team
server {
        listen       80;
        server_name alertmanager.dscl.team;
        location / {
           #client_max_body_size    1000m;
                   proxy_set_header X-Real-IP $remote_addr;
           proxy_set_header HOST $http_host;
           proxy_set_header X-NginX-Proxy true;
           proxy_pass http://127.0.0.1:9093;
           root   html;
           index  index.html index.htm;
        }
}

# wps.dscl.team
server {
        listen       80;
        server_name wps.dscl.team;
        location / {
           #client_max_body_size    1000m;
                   proxy_set_header X-Real-IP $remote_addr;
           proxy_set_header HOST $http_host;
           proxy_set_header X-NginX-Proxy true;
           proxy_pass http://host6:80;
           root   html;
           index  index.html index.htm;
        }
}
在 master 中实验室论坛静态页面上增加新增服务的跳转链接。
/home/dscl/dscl-web/index.html里面的内部服务增加几个项目
3.2.2. grafana配置
在进行完以上步骤后,需要对 grafana 进行配置,根据参考文件提示的步骤操作即可。 目前使用的模板是(模板市场):
3.2.3. 参考文献:
3.3. 备份
监控服务 node_exporter 上报的数据会被 prometheus 存储起来,这个目录暂时没有挂载出来,如果需要备份,需要对这个目录进行挂载。监控主要是为了发现集群近期的问题,暂时觉得没有必要对过去数据进行保留,如果服务出现问题,重新按照安装部署步骤进行部署即可。
3.4. 其他可能
ehds 同学提示 alertmanager 能够通过 webhook 协议把告警信息发到飞书、企业微信等设备中。
发现有这么一个比较重的全家桶,如有需要可以搭建。
3.5. 配置文件
alertmanager.yml
global:
  resolve_timeout: 5m
  smtp_from: 'cddscl@163.com' # 实验室告警邮箱使用的是163
  smtp_smarthost: 'smtp.163.com:25'
  smtp_auth_username: '<account>@163.com'
  smtp_auth_password: '<secret>'
  smtp_require_tls: false
  smtp_hello: '163.com'
route:
  group_by: ['alertname']
  group_wait: 5s
  group_interval: 5s
  repeat_interval: 5m
  receiver: 'email'
receivers:
- name: 'email'
  email_configs:
  - to: '<admin1>@xxx.com, <admin2>@xxx.com' # 管理员邮箱
    send_resolved: true
inhibit_rules:
  - source_match:
      severity: 'critical'
    target_match:
      severity: 'warning'
    equal: ['alertname', 'dev', 'instance']
alert_rules.yml
groups:
- name: example
  rules:

  # Alert for any instance that is unreachable for >5 minutes.
  - alert: InstanceDown
    expr: up == 0
    for: 5m
    labels:
      severity: page
    annotations:
      summary: "Instance {{ $labels.instance }} down"
      description: "{{ $labels.instance }} of job {{ $labels.job }} has been down for more than 5 minutes."

  # Alert for any instance that has a median request latency >1s.
  - alert: APIHighRequestLatency
    expr: api_http_request_latencies_second{quantile="0.5"} > 1
    for: 10m
    annotations:
      summary: "High request latency on {{ $labels.instance }}"
      description: "{{ $labels.instance }} has a median request latency above 1s (current value: {{ $value }}s)"

  - alert: HostCPU
    expr: 100 * (1 - avg(irate(node_cpu_seconds_total{mode="idle"}[2m])) by(instance)) > 95
    for: 5m
    labels:
      serverity: high
    annotations:
      summary: "{{$labels.instance}}: High CPU Usage Detected"
      description: "{{$labels.instance}}: CPU usage is {{$value}}, above 95% for more than 5 minutes"

  - alert: HostMemory
    expr: (node_memory_MemTotal_bytes - node_memory_MemAvailable_bytes) / node_memory_MemTotal_bytes * 100 > 95
    for: 5m
    labels:
      serverity: middle
    annotations:
      summary: "{{$labels.instance}}: High Memory Usage Detected"
      description: "{{$labels.instance}}: Memory Usage i{{ $value }}, above 95% for more than 5 minutes"

  - alert: HostDiska
    expr: 100 * (node_filesystem_size_bytes{fstype=~"xfs|ext4"} - node_filesystem_avail_bytes) / node_filesystem_size_bytes > 90
    for: 5m
    labels:
      serverity: high
    annotations:
      summary: "{{$labels.instance}}: High Disk Usage Detected"
      description: "{{$labels.instance}}, mountpoint {{$labels.mountpoint}}: Disk Usage is {{ $value }}, above 90% for more than 5 minutes"

  # https://blog.51cto.com/shoufu/2561994
  - alert: HostPhysicalComponentTooHot
    expr: node_hwmon_temp_celsius > 40
    for: 5m
    labels:
      severity: warning
    annotations:
      summary: "Host physical component too hot (instance {{ $labels.instance }})"
      description: "Physical hardware component too hot\n  VALUE = {{ $value }}\n  LABELS: {{ $labels }}"
grafana
# grafana.ini
# 默认配置即可
prometheus.yml
# my global config
global:
  scrape_interval: 15s # Set the scrape interval to every 15 seconds. Default is every 1 minute.
  evaluation_interval: 15s # Evaluate rules every 15 seconds. The default is every 1 minute.
  # scrape_timeout is set to the global default (10s).

# Alertmanager configuration
alerting:
  alertmanagers:
    - static_configs:
            - targets: ["master:9093"]
          #           - alertmanager:9093

# Load rules once and periodically evaluate them according to the global 'evaluation_interval'.
rule_files:
    - "/etc/prometheus/alert_rules.yml"
  # - "second_rules.yml"

# A scrape configuration containing exactly one endpoint to scrape:
# Here it's Prometheus itself.
scrape_configs:
  # The job name is added as a label `job=<job_name>` to any timeseries scraped from this config.
  #- job_name: "prometheus"

    # metrics_path defaults to '/metrics'
    # scheme defaults to 'http'.

    # static_configs:
    #  - targets: ["localhost:9010"]
  # host2-host6 集群监控
  - job_name: "hosts"

    # metrics_path defaults to '/metrics'
    # scheme defaults to 'http'.
    static_configs:
      - targets: ["host2:9109","host3:9109","host4:9109","host5:9109","host6:9109","master:9109"]